Promarks IntelProperty Market ResearchHeatmaps, house types, site intelligence and appraisal tools
Promarks Intel Heatmap Intelligence

See the market. Understand the stock. Test viability.

Promarks Intel turns residential evidence into an interactive spatial view. Move from regional patterns to neighbourhood detail, switch between Market, Housing Stock and Viability, and apply the filters that matter to the appraisal in front of you.

Market: sold values, £/ft², house size and local evidence.
Housing Stock: stock, density, type, bedrooms, tenure and turnover.
Viability: build cost, gross screening and adjusted appraisal assumptions.
Built for evidence: confidence controls, sample counts, labels and local inspector views.
Full Promarks Intel platform access is available from £9 per user / month, with short-term 7-Day Pass access also available.
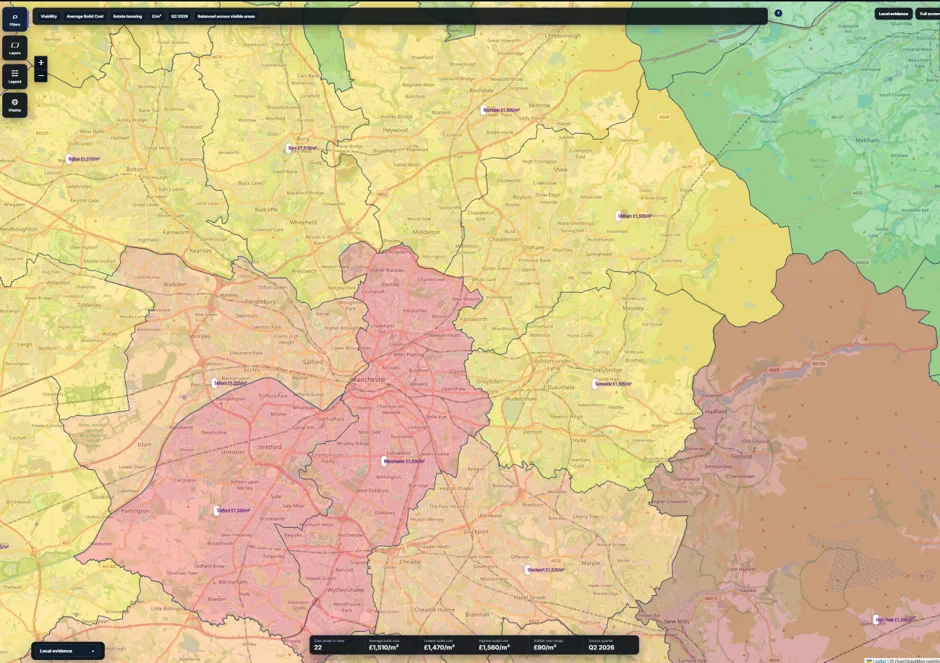
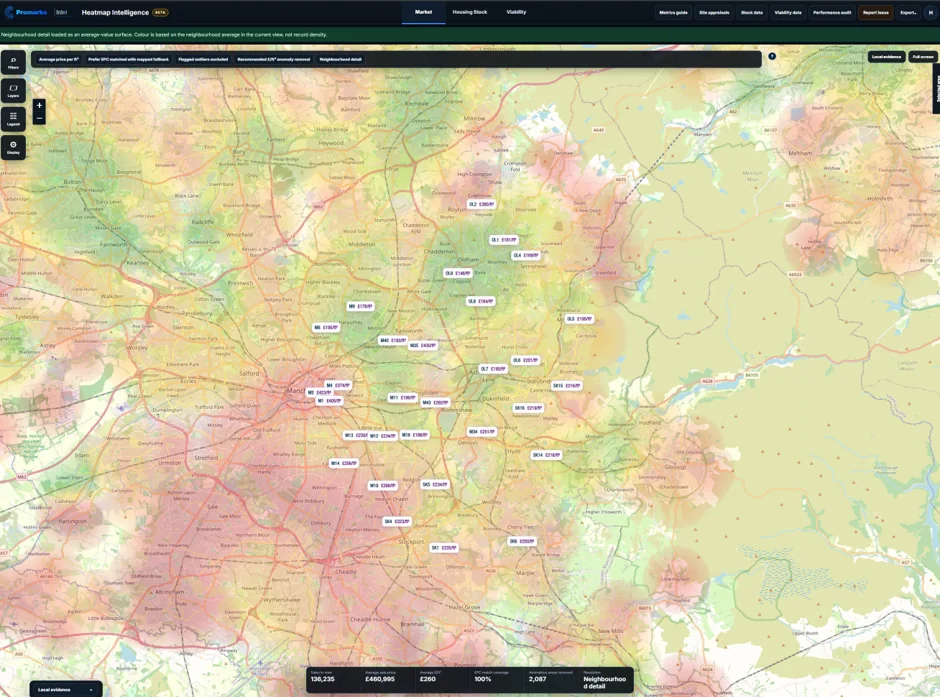
Promarks Intel Market Heatmap showing regional residential price per square foot patterns
MarketRegional → neighbourhoodAverage-value surface
Free to explore

Try the Promarks Intel Heatmap before you subscribe.

Search an area, switch between Market, Housing Stock and Adjusted Viability, and move around the map. The public preview deliberately hides the figures, detailed filters, assumptions and methodology - exactly where the full Promarks Intel subscription takes over.

Public preview: visual pattern and area names only. Export a redacted preview by email, or unlock the commercial-grade figures and filters inside Promarks Intel.Explore in a larger window
The core spatial intelligence tool

One Heatmap. Three different ways to understand a residential market.

Heatmap Intelligence is designed for the questions that come up before and during an appraisal: where values strengthen or weaken, what sort of housing already exists, how dense the stock is, and whether local value evidence appears to provide headroom over benchmark development costs.

Colour is based on the average value represented in the current view — not simply where the most records happen to exist.
Regional to neighbourhood detailStart wide to understand the market pattern, then zoom into local evidence without changing tools.
Evidence behind the colourUse local labels, counts, confidence and inspector information to understand what is supporting the surface.
Heat Surface or Area FillUse blended surfaces for spatial patterns or actual geography fills where an administrative area view is more useful.
Filters built for live appraisal workChange dates, property evidence, stock measures, development assumptions and geography without leaving the map.
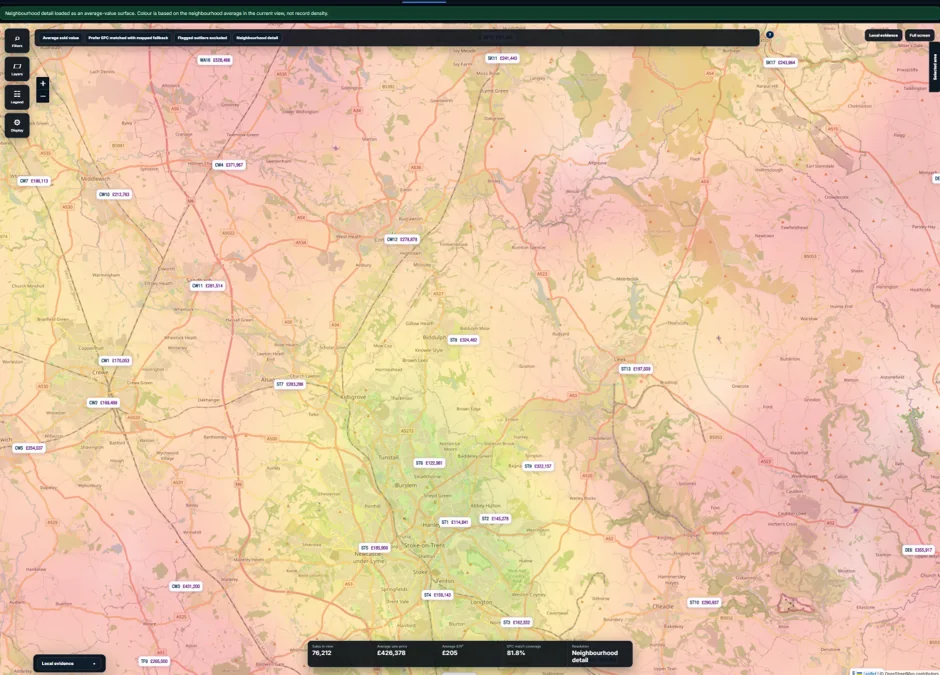
Promarks Intel Market Heatmap at neighbourhood detail with postcode value labels
Heatmap domain 01

Market

See how residential sale values change spatially, then narrow the evidence to match the instruction or site you are assessing.

  • Average sold value, average £/ft² and average house size.
  • Sale month from / to and new-build versus pre-owned evidence.
  • Property type and house-size bands.
  • EPC-matched evidence, mapped fallback and stricter confidence modes.
  • Flagged-outlier control and robust £/ft² anomaly screening.
  • Local labels, sales counts, EPC match coverage and evidence inspection.
Best used for market positioning, comparable-area review, value pattern analysis and understanding how local evidence changes across a site search area.
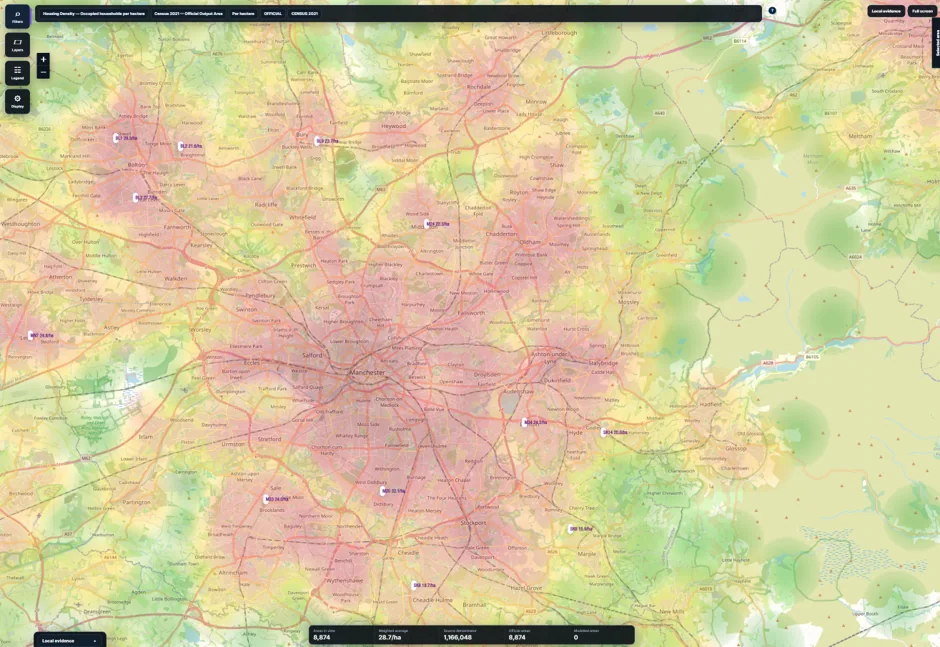
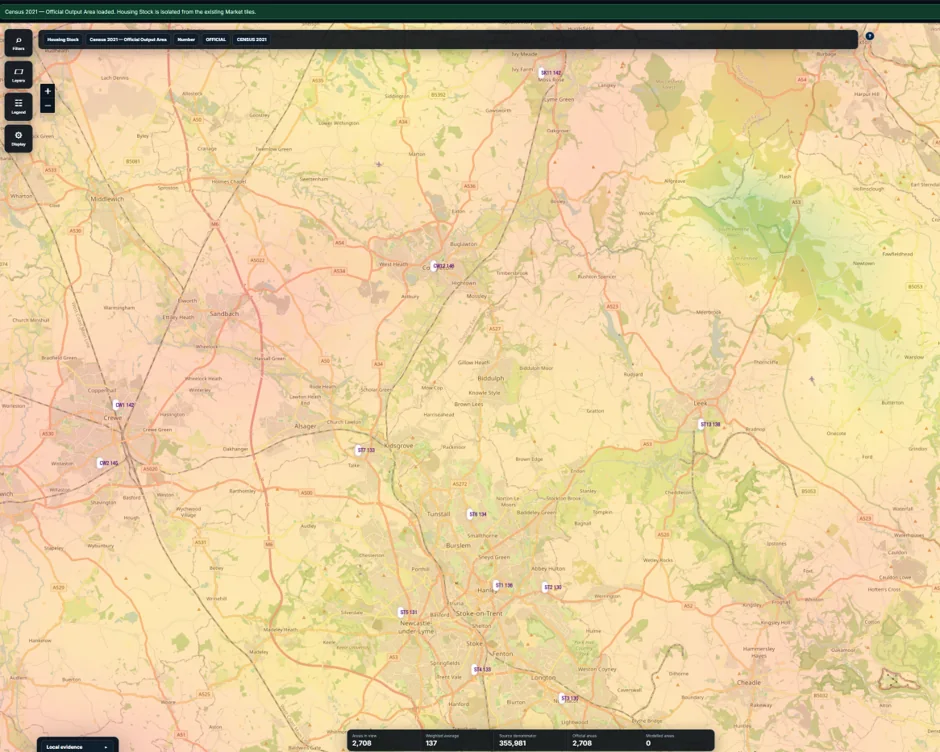
Promarks Intel Housing Stock Heatmap showing residential housing density
Heatmap domain 02

Housing Stock

Move beyond sales evidence and understand the structure of the housing already on the ground.

  • Total housing stock and multiple housing-density measures.
  • Detached, semi-detached, terraced, flat and other dwelling types.
  • 1, 2, 3 and 4+ bedroom bands plus small-home and family-home groupings.
  • Owner occupation, shared ownership, social rent and private rent.
  • Residential stock turnover, including turnover by property type.
  • Census 2021 Official Output Area, Promarks Detailed Estimate and VOA 2025 LSOA bases where available.
Display the selected measure as a number, percentage, per-hectare density or annual turnover rate depending on the layer.
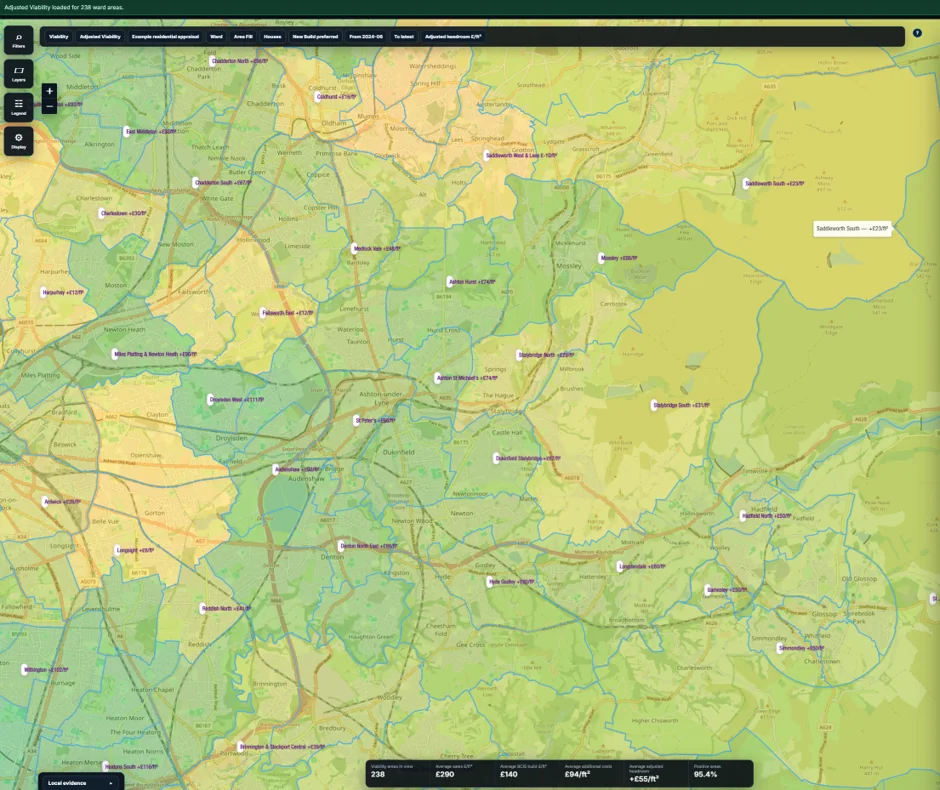
Promarks Intel Adjusted Viability Heatmap shown by Ward
Heatmap domain 03

Viability

Combine local sales evidence with benchmark build costs and an adjustable cost model to screen where value-to-cost relationships look stronger or weaker.

  • Average Build Cost, Gross Viability and Adjusted Viability views.
  • Postcode Outcode, Ward and Council / Borough geography.
  • Heat Surface or actual Area Fill rendering.
  • Houses, flats or mixed residential development scenarios.
  • New-build preferred, new-build only, all sales or pre-owned evidence.
  • Professional fees, contingency, abnormal build cost, planning fees, S106/CIL, marketing, developer profit and finance assumptions.
Viability is an area-level screening tool using BCIS cost-area benchmarks and adopted assumptions. It is not a site-specific valuation or residual land valuation.

Filter the evidence, not just the picture.

The Heatmap is useful because the user can change the underlying evidence and calculation basis. The visual surface responds to the live filter set rather than being a fixed marketing map.

Market filters

Average sold valueAverage £/ft²Average house sizeDate rangeNew / pre-ownedProperty typeHouse sizeEPC confidenceOutliersAnomaly screening

Use stricter evidence when required, or broaden the mapped fallback where local matched evidence is thin.

Housing Stock filters

Data basisTotal stockDensityHouse typeBedroomsTenureTurnoverNumberPercentagePer hectareAnnual rate

Switch between official-area data and detailed Promarks modelling where available, then choose the measure that best explains the local stock.

Viability filters

Build costGross viabilityAdjusted viabilityOutcode / Ward / CouncilHeat Surface / Area FillHouses / Flats / MixedSales evidenceDate rangeCost assumptions

Move from a simple value-versus-build screen into a more realistic adjusted headroom view with your own cost assumptions.

Land & acquisitionQuickly understand whether a site sits in a stronger or weaker local value area and how the surrounding stock changes.
Market researchMove from broad market context into filtered local evidence without manually assembling multiple maps and spreadsheets.
Development appraisalTest sales evidence against build-cost benchmarks and adjusted assumptions as an early viability screen.
Valuation & agencyUse spatial evidence to explain local value variation, competing stock and market context more clearly to clients.

See your next appraisal on the Heatmap.

Book a demonstration and we can run through Market, Housing Stock and Viability on an area you already know, so you can compare the output with your own market knowledge.

Beyond the Heatmap

The map is the headline tool — the rest of Promarks Intel turns the evidence into a working research platform.

Move from spatial intelligence into house type benchmarking, competing-site review, area intelligence and appraisal outputs without changing systems.

Heatmap IntelligenceMarket, Housing Stock and Viability with live filters, local evidence and multiple geography levels.
House TypesSearch and filter product records by developer, beds, type, storeys and size, then open or compare relevant designs.
Site OverviewReview tracked sites with location, mix, units, affordable provision, density and mapped access.
Area IntelligenceOpen Council, Ward, Postcode Area and Outcode profiles with headline metrics, trends, rankings and comparable areas.
Accommodation SchedulesBuild and format appraisal schedules, choose visible columns and create clean export-ready outputs.
Reports & SnapshotsTurn the same intelligence into structured Area Intelligence and Borough Snapshot outputs without re-keying the evidence.
Public search preview

Search the House Type Database from the marketing page.

Use the embedded public preview to search house names, types and developers. The public view keeps detailed size and design information redacted until login or pass access.

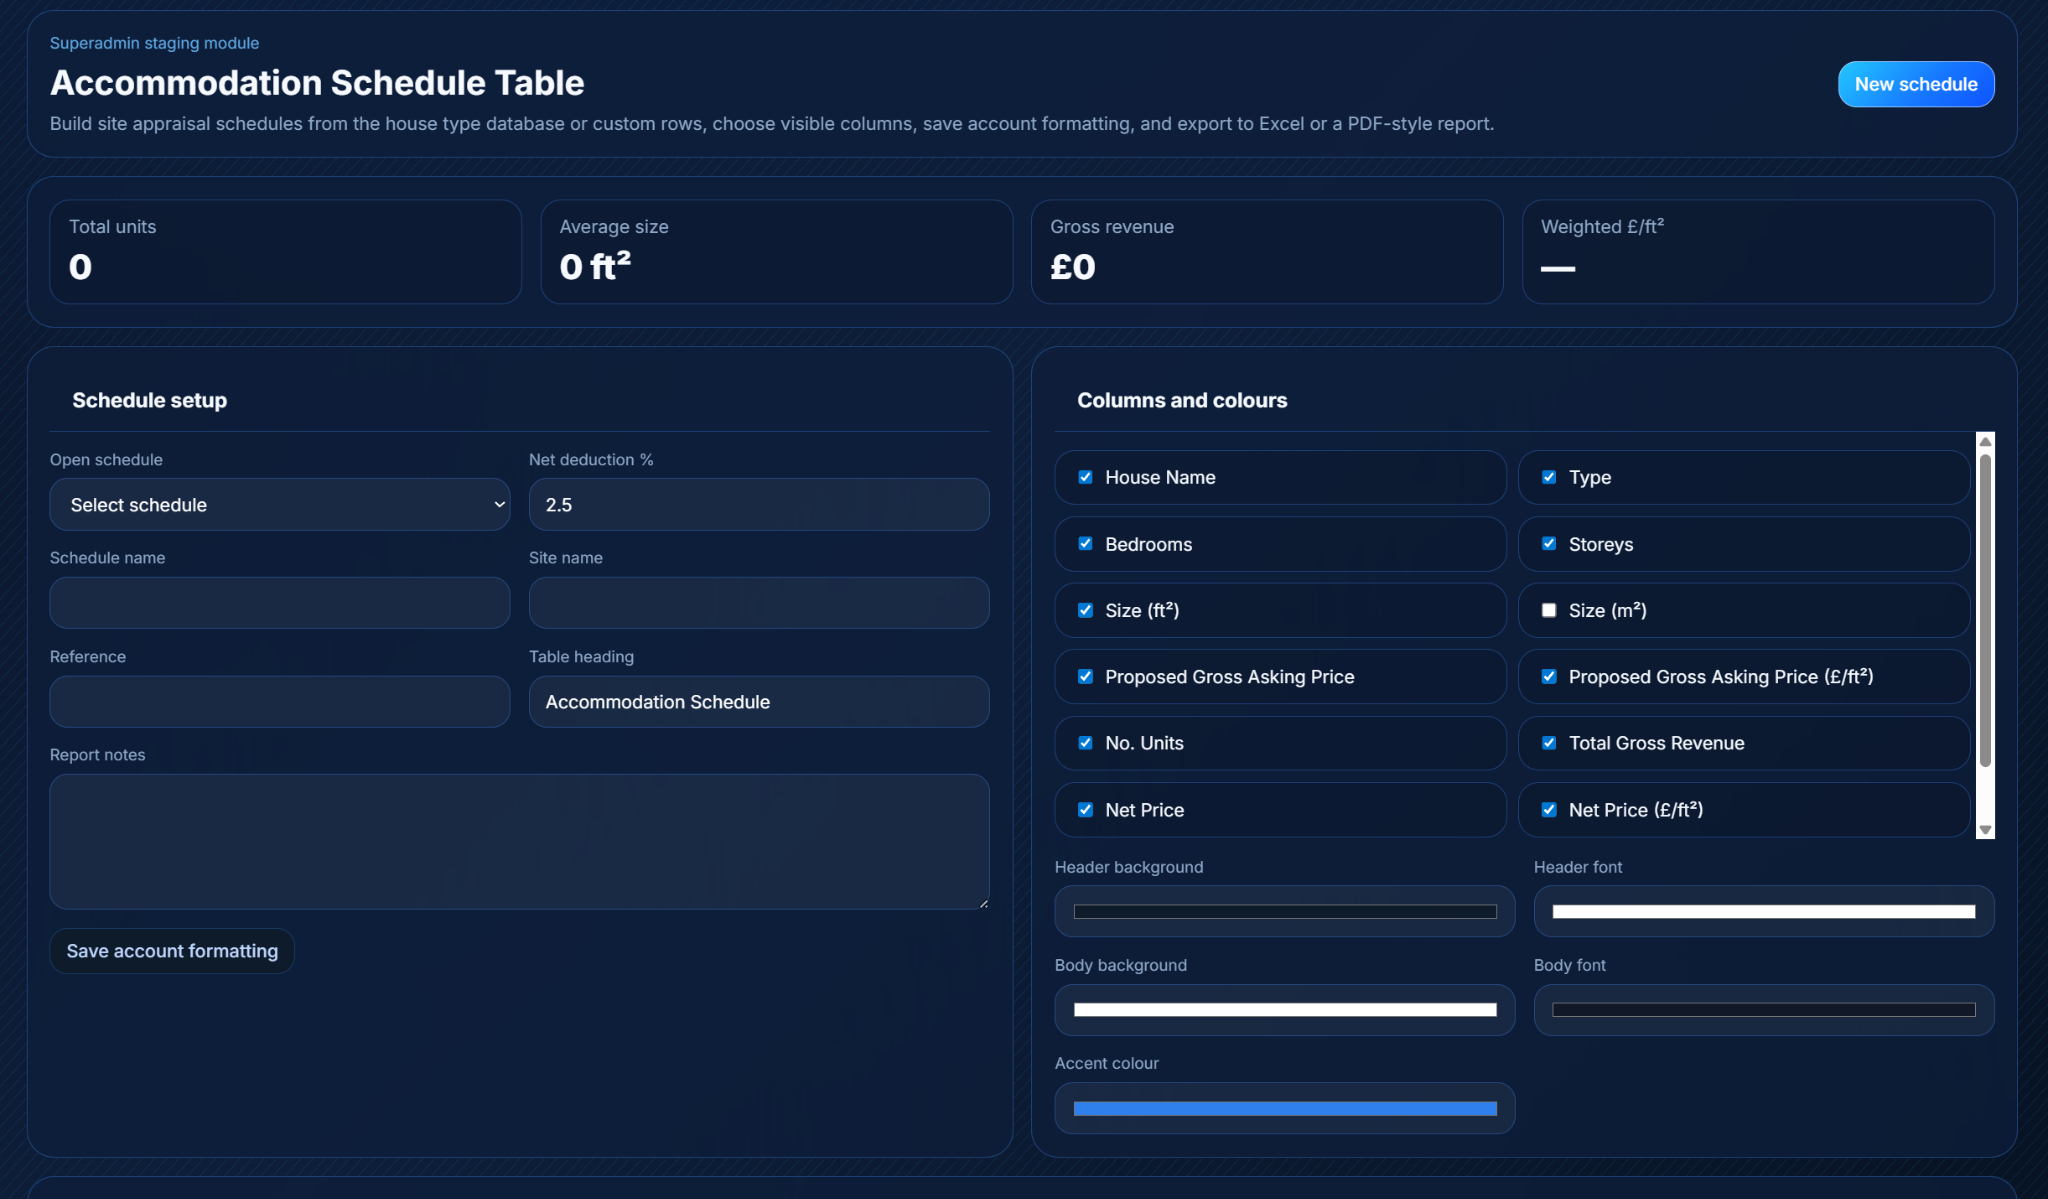
Free accommodation schedule

Build a simple accommodation schedule before you subscribe.

Visitors can build a schedule without logging in. The export asks for an email address before download, while full Promarks Intel access adds the wider research, Heatmap and appraisal workspace.

Add house names, type, beds, size, price and units
Live totals for units, average size and revenue
Email required only when exporting
Move into full Promarks Intel when the appraisal needs wider evidence
More of the workspace

Heatmaps sit alongside the product, site and appraisal tools.

Promarks Intel is designed as a working database rather than a single map. These screens show the other core tools available alongside Heatmap Intelligence.

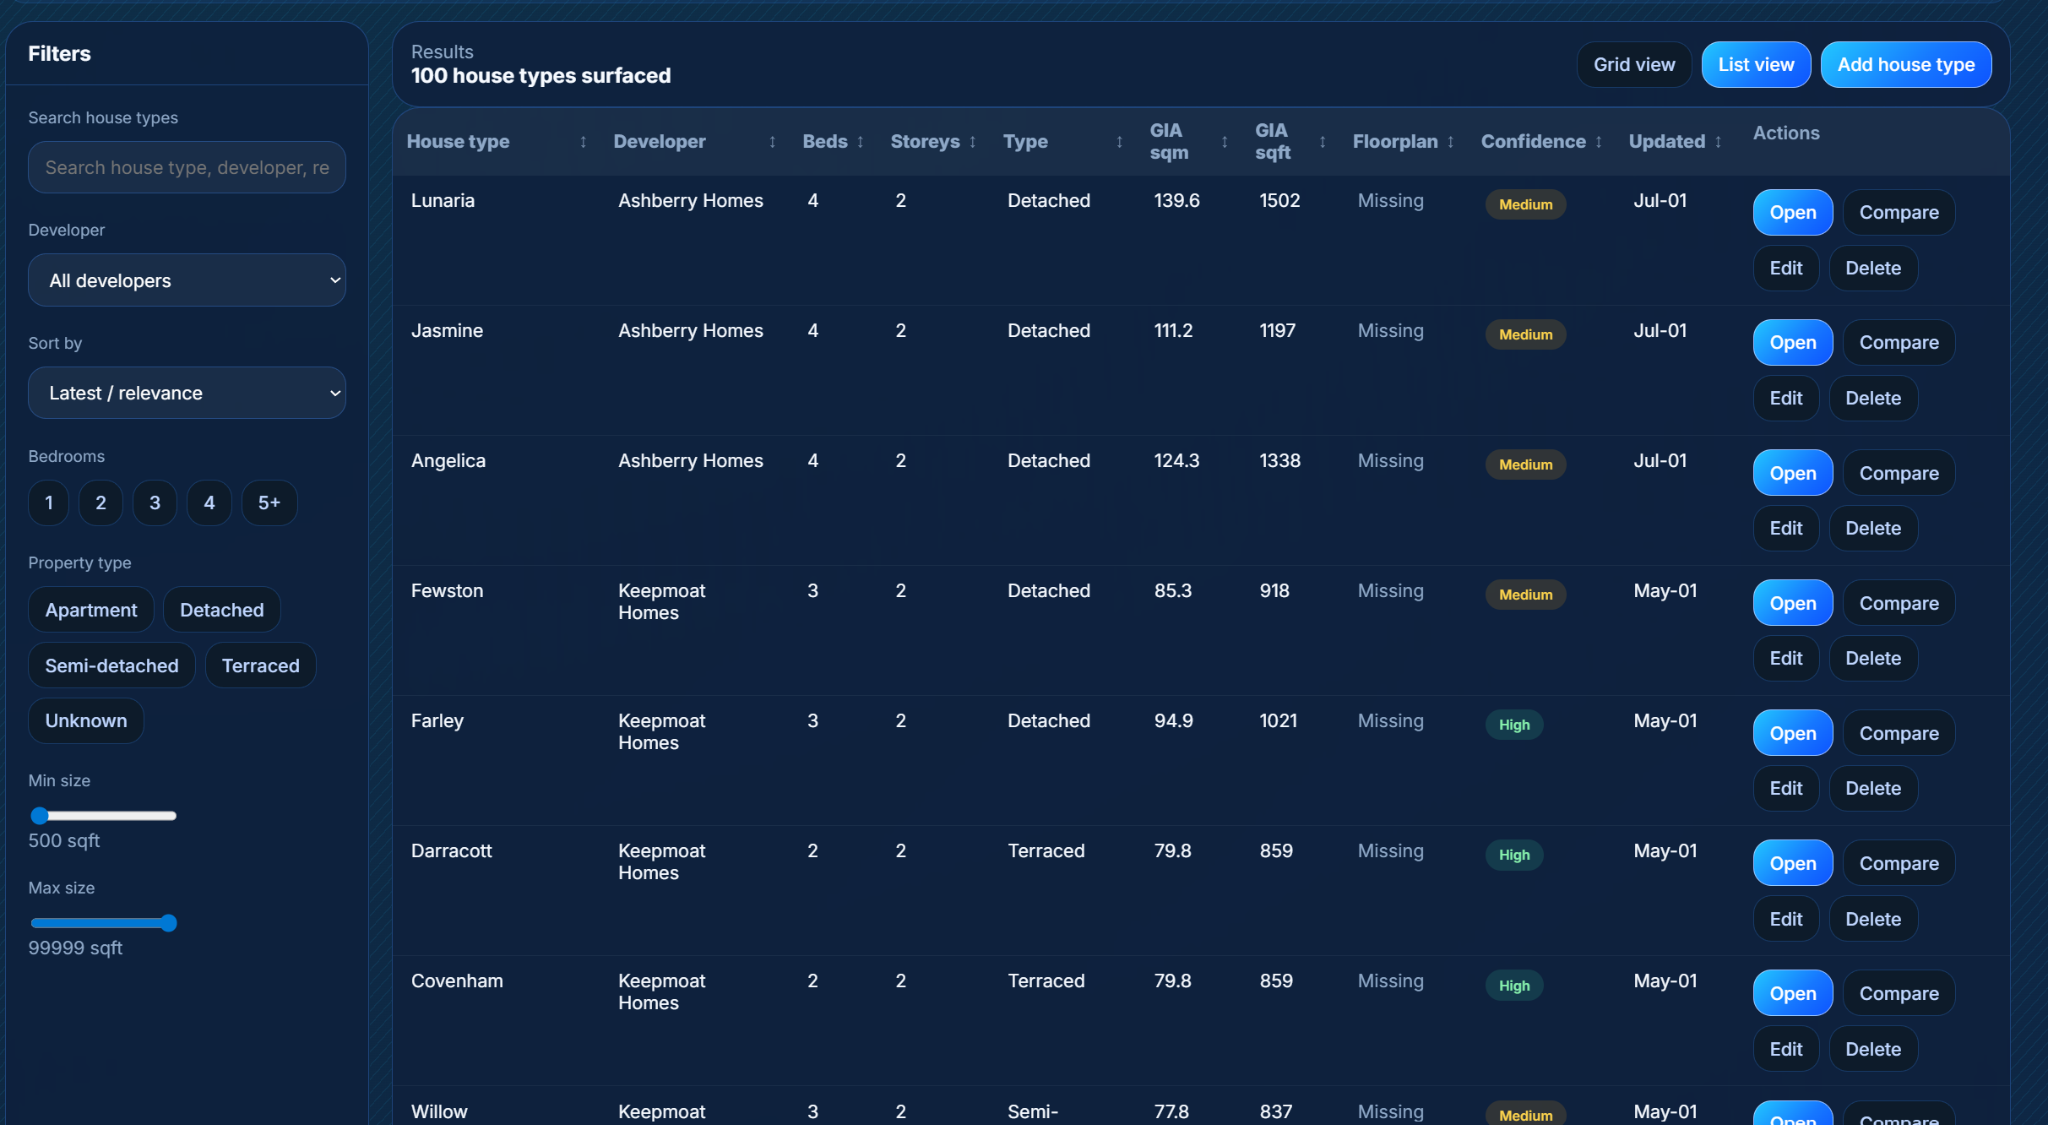
House Types database

Filter house type records and open or compare relevant designs.

House types database screenshot

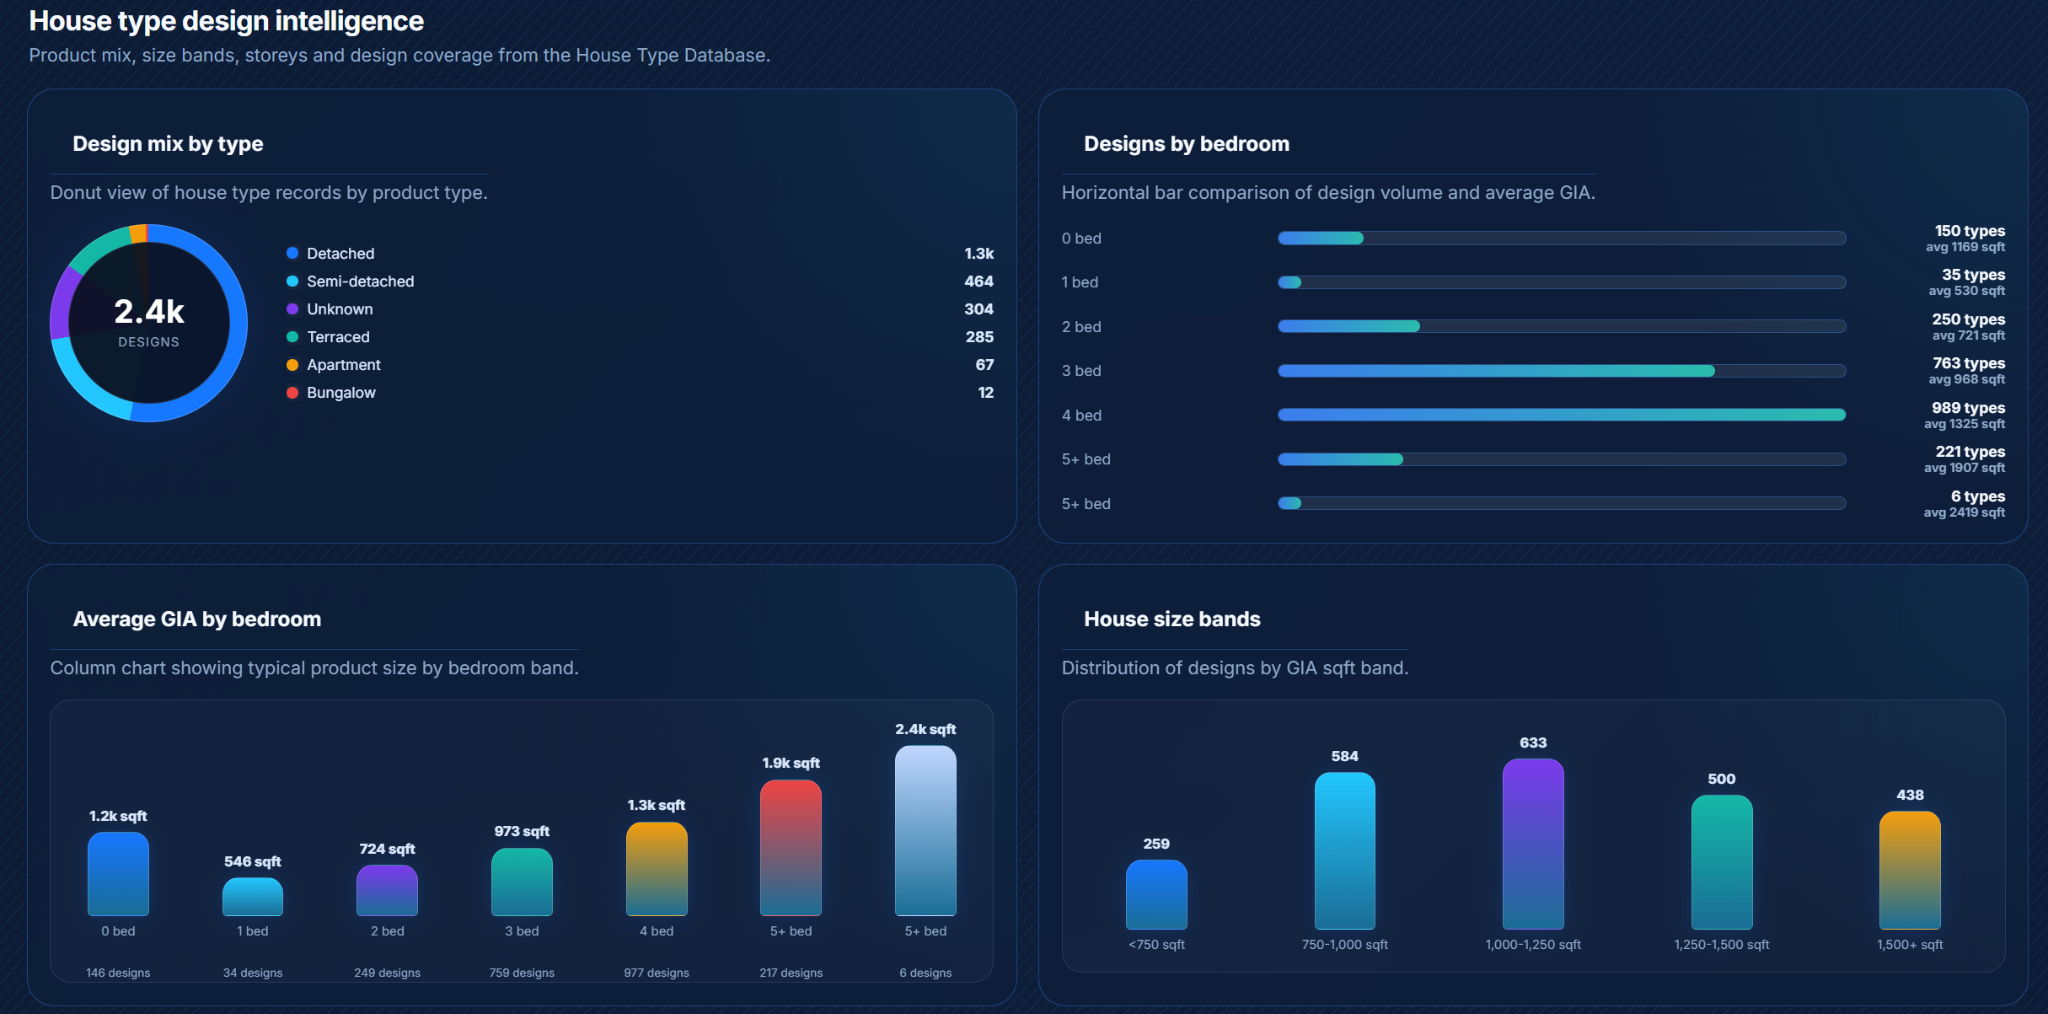
House type insights

Visualise design mix, bedroom distribution and size bands from the house type database.

House type intelligence screenshot

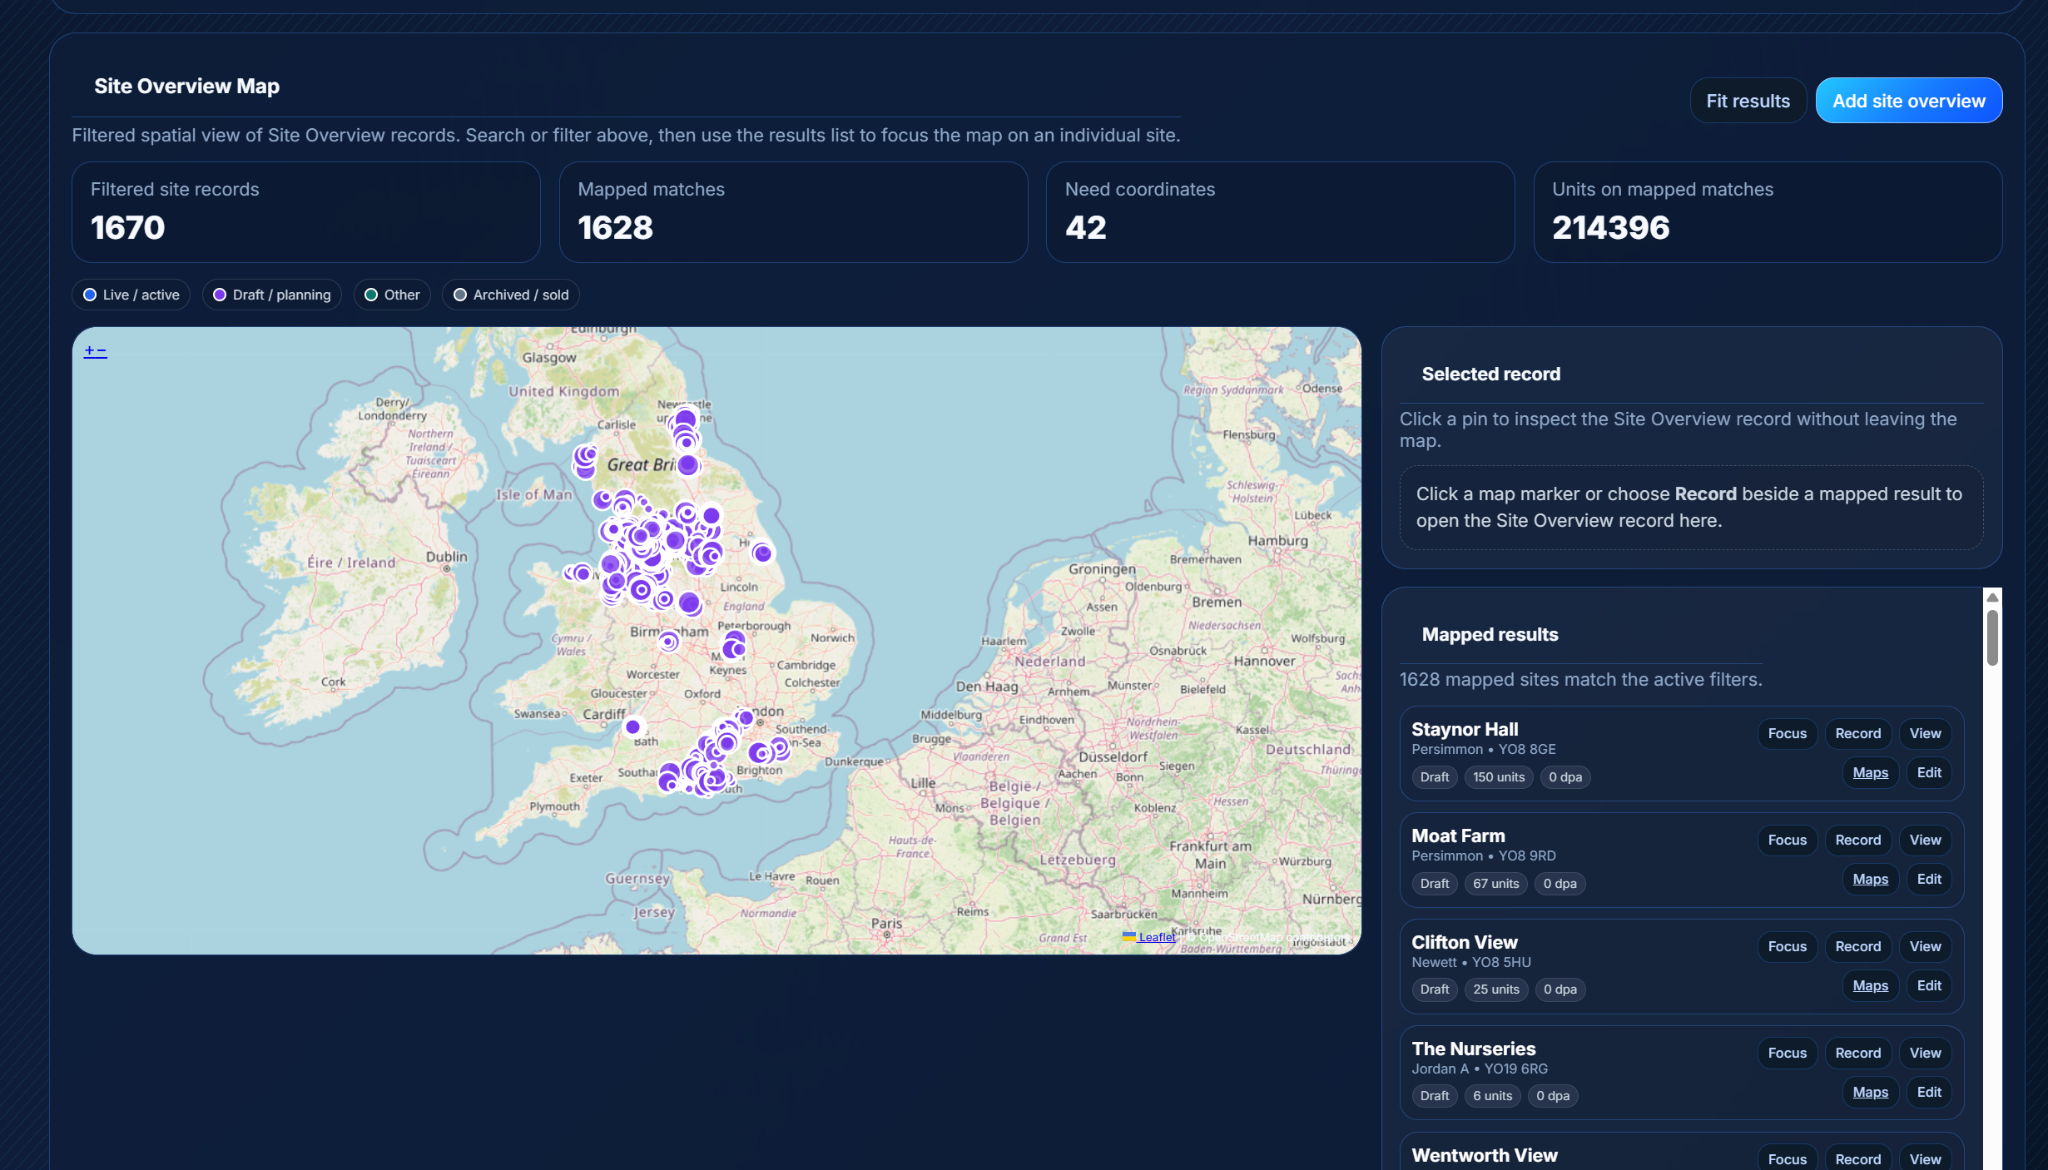
Site Overview map

Inspect mapped site records and selected site details in a spatial view.

Site Overview map screenshot

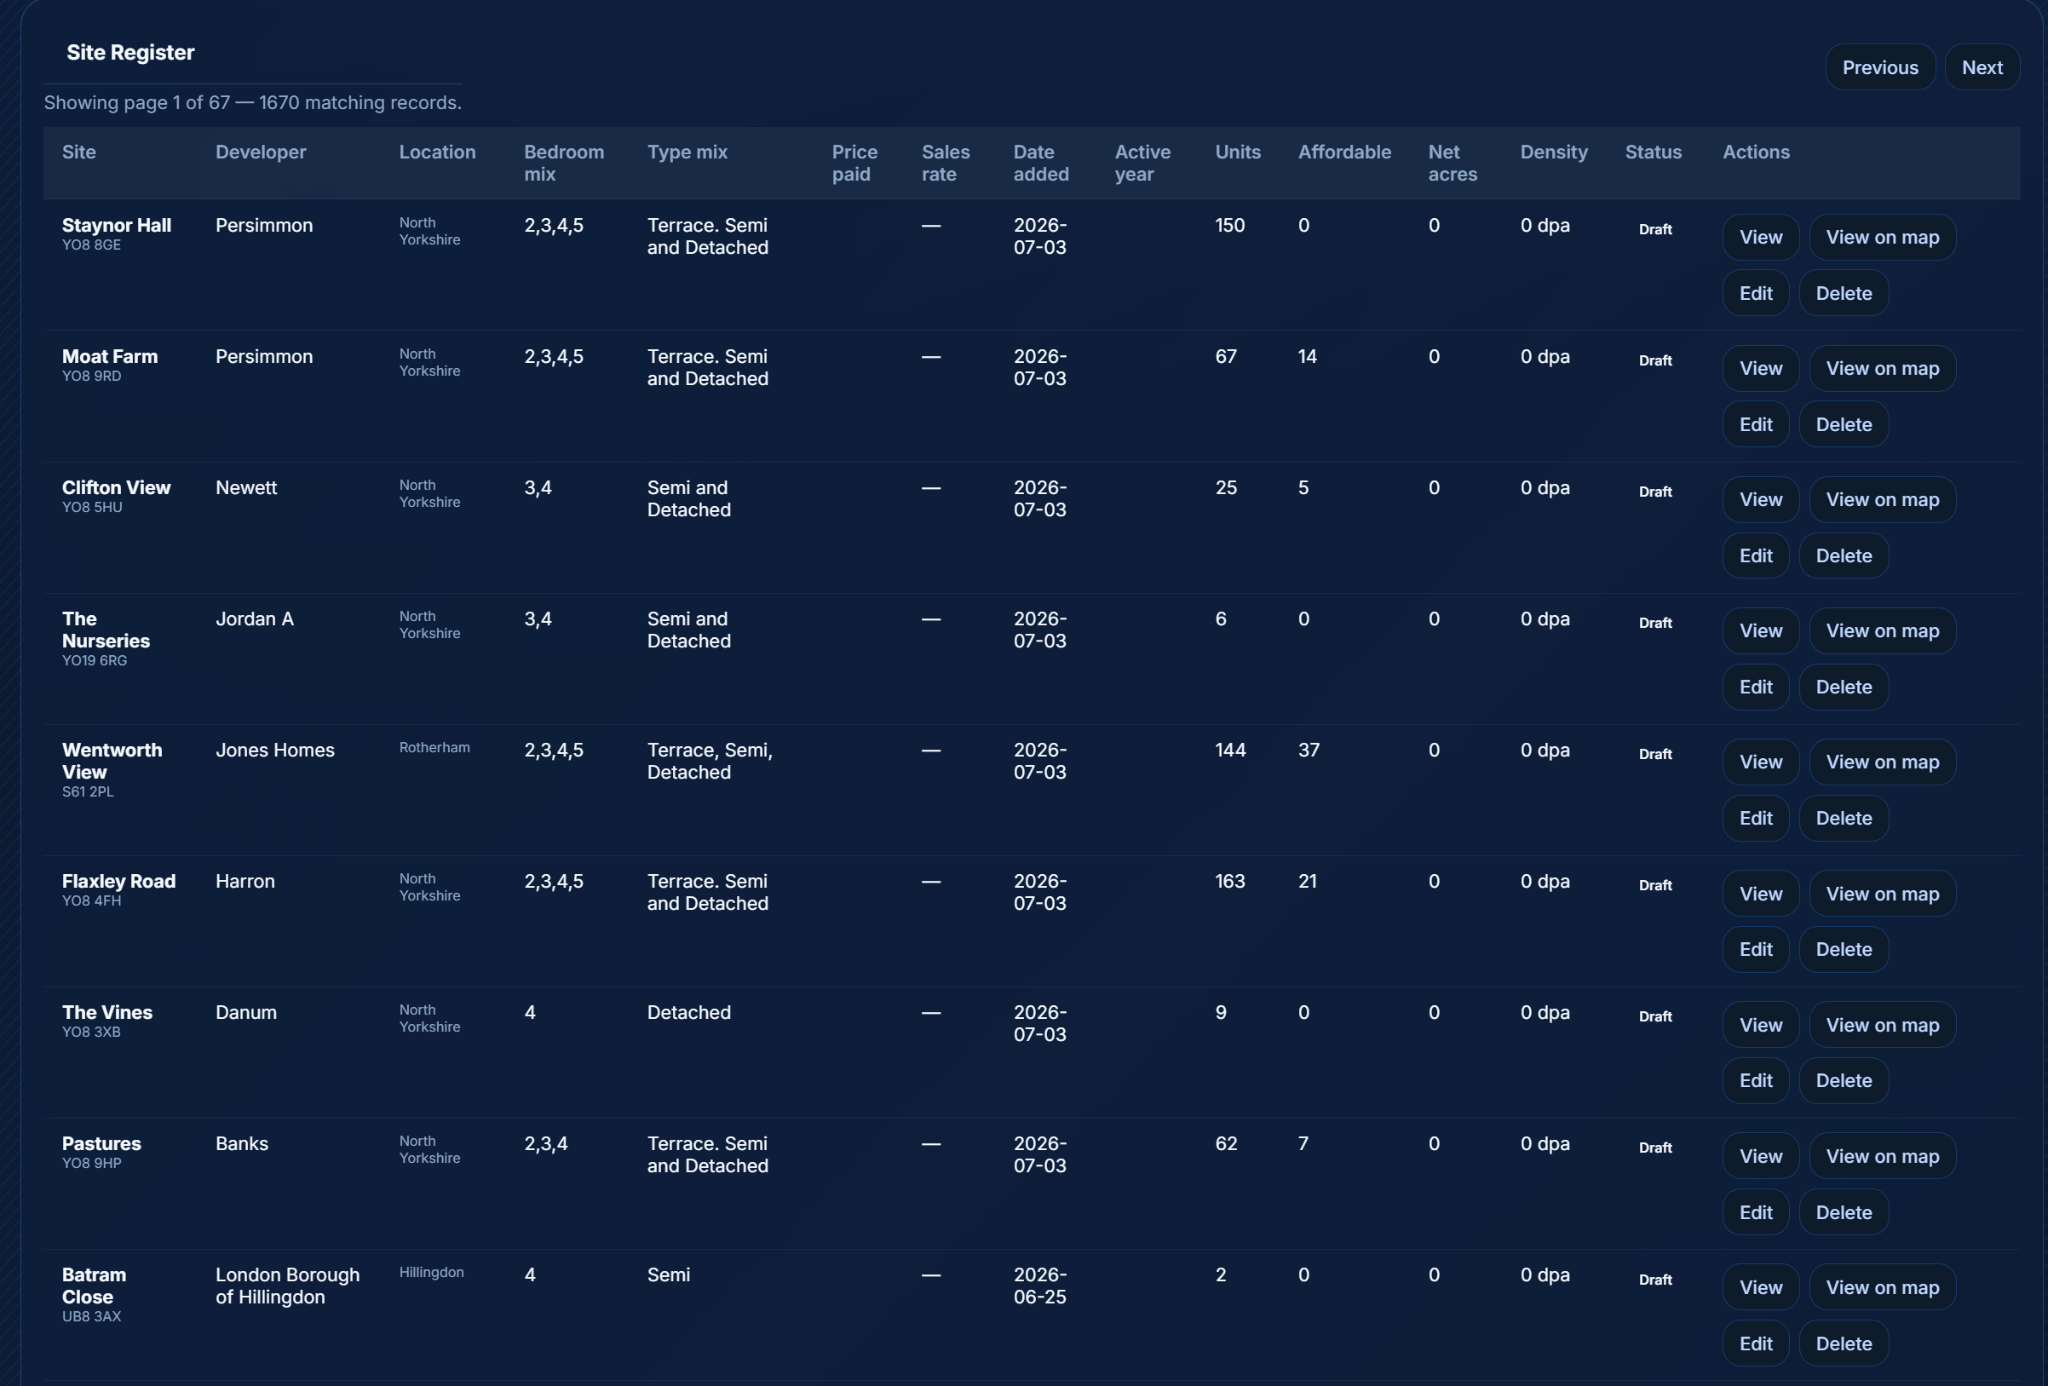
Site Register

Review tracked sites in a structured register with status, units, location and quick actions.

Site register screenshot

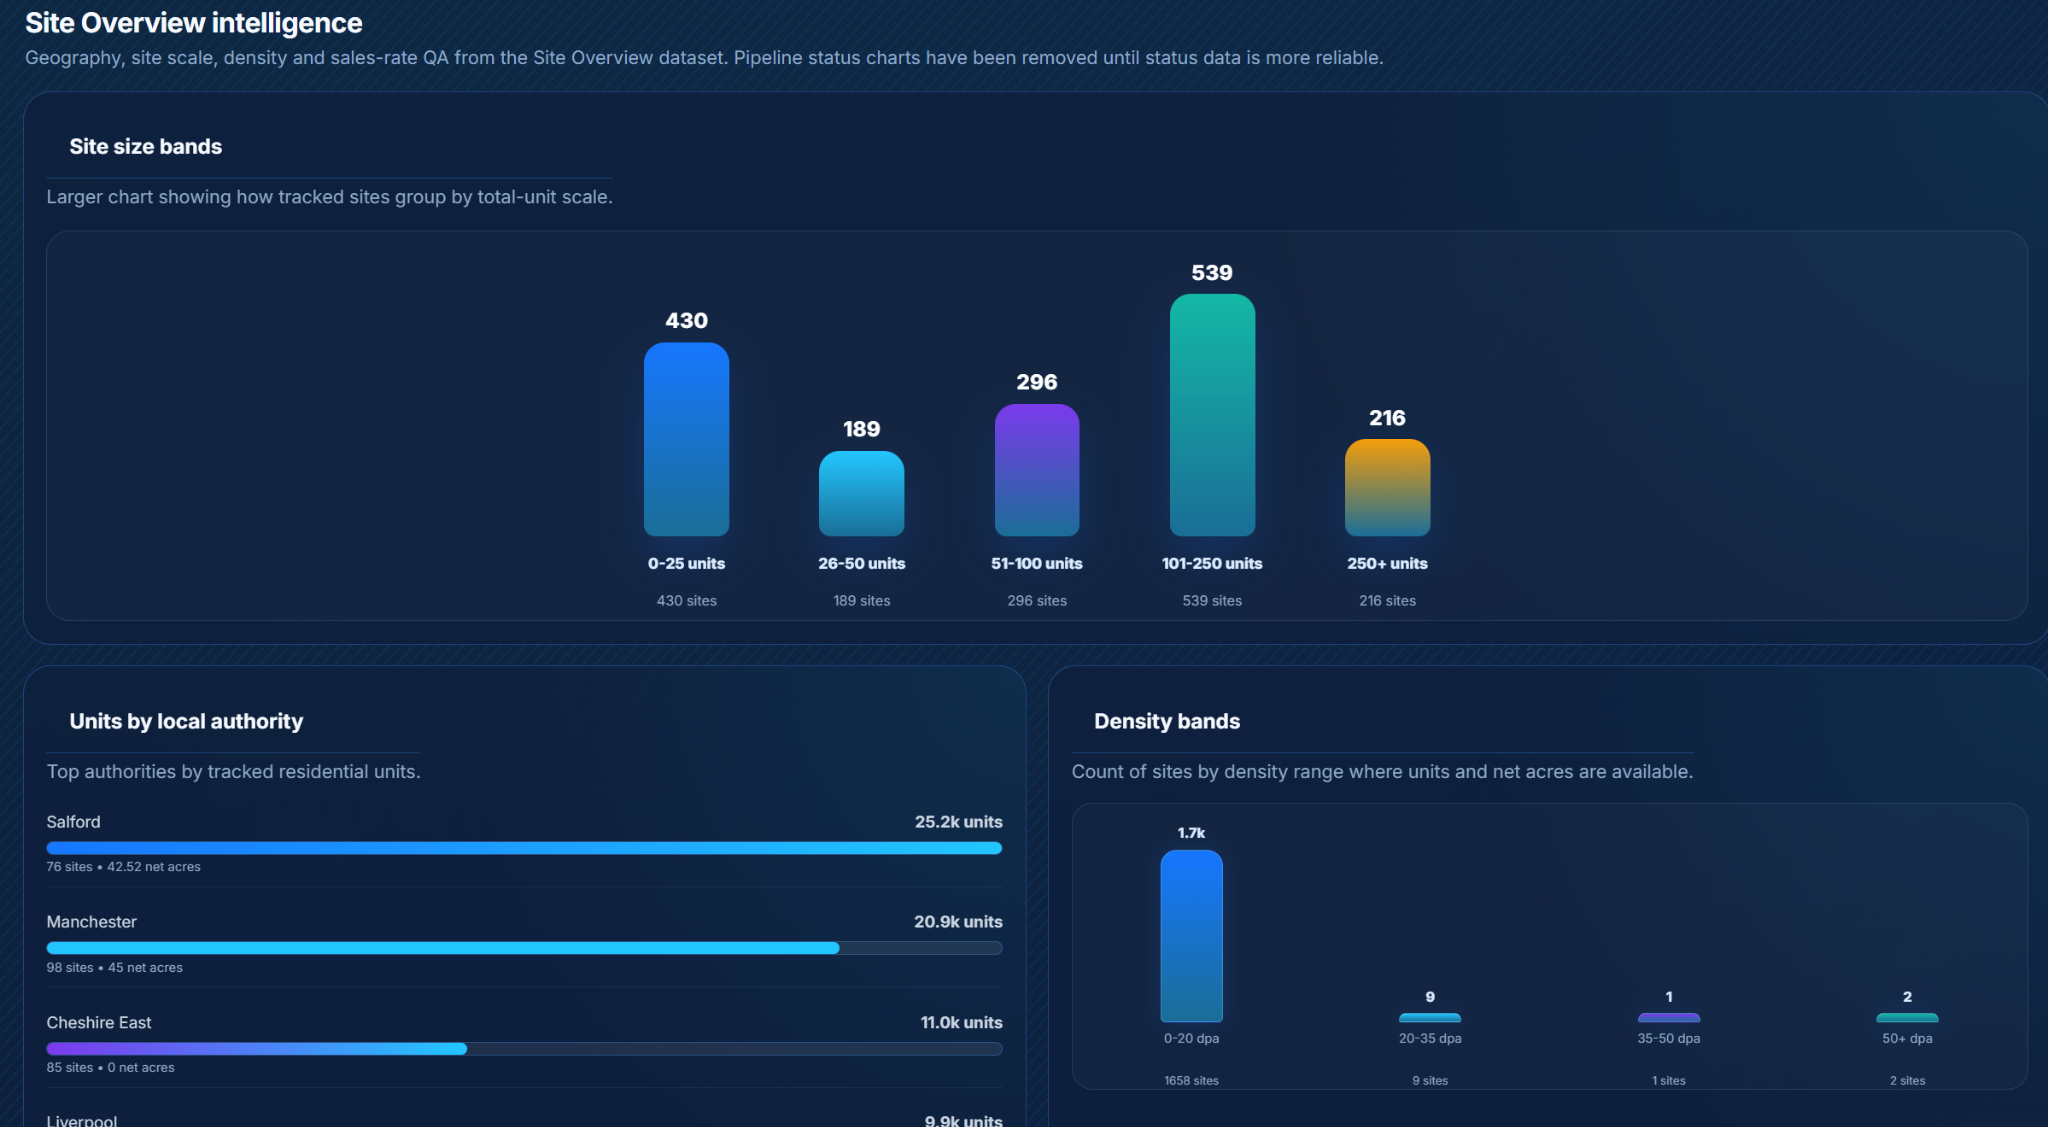
Site overview insights

Assess site size bands, local authority concentration and density information.

Site overview insights screenshot

Accommodation Schedule Table

Build schedules, choose visible columns, save account formatting and export clean outputs.

Accommodation schedule table screenshot

Access Promarks Intel

Book a Heatmap demonstration, log in to the full workspace or use a 7-Day Pass when you need short-term access for an appraisal, pitch or live consultancy instruction.